The Scriptworks Dashboard has had a face-lift to accommodate a few new features.
The results Dashboard has been improved to include new charts and graphs for projects test runs.
A peek at the new features is shown below.
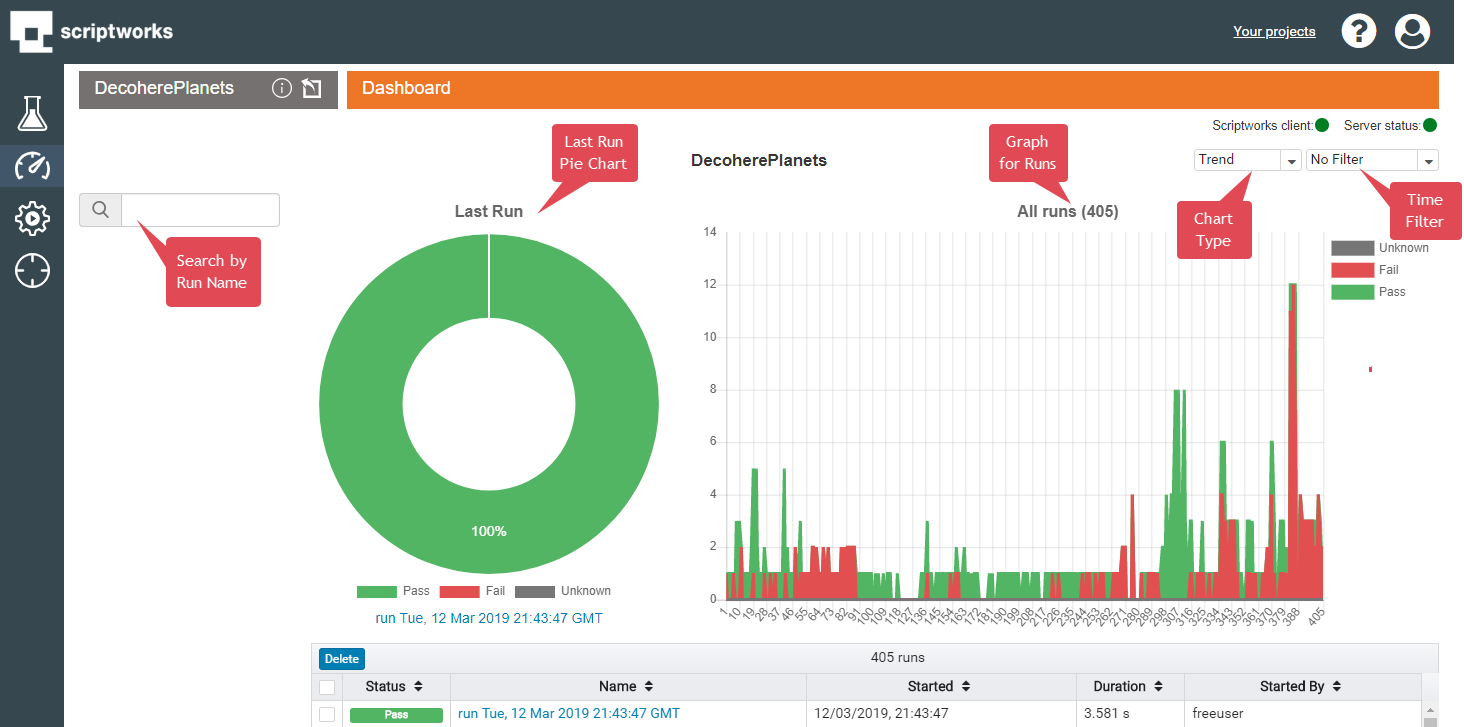
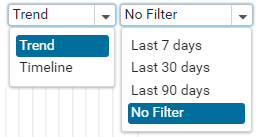
There is now a choice between using a Trend or a Timeline graph for project test runs, as well as being able to select from “All Time”, 7, 60 or 90 days to provide some overview for results and to show trends.
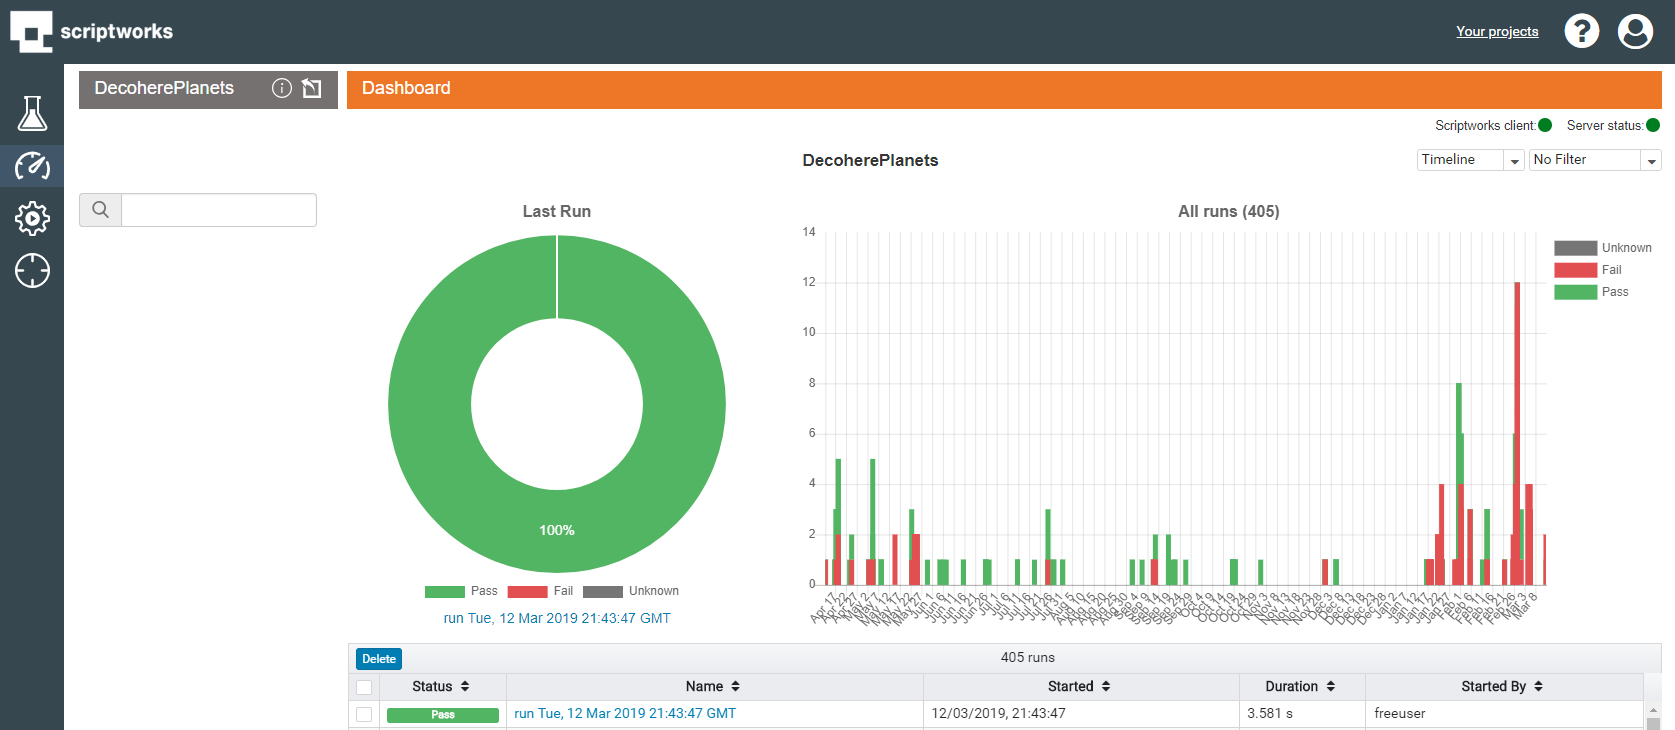
The Timeline graph for "All Time" will look like this:
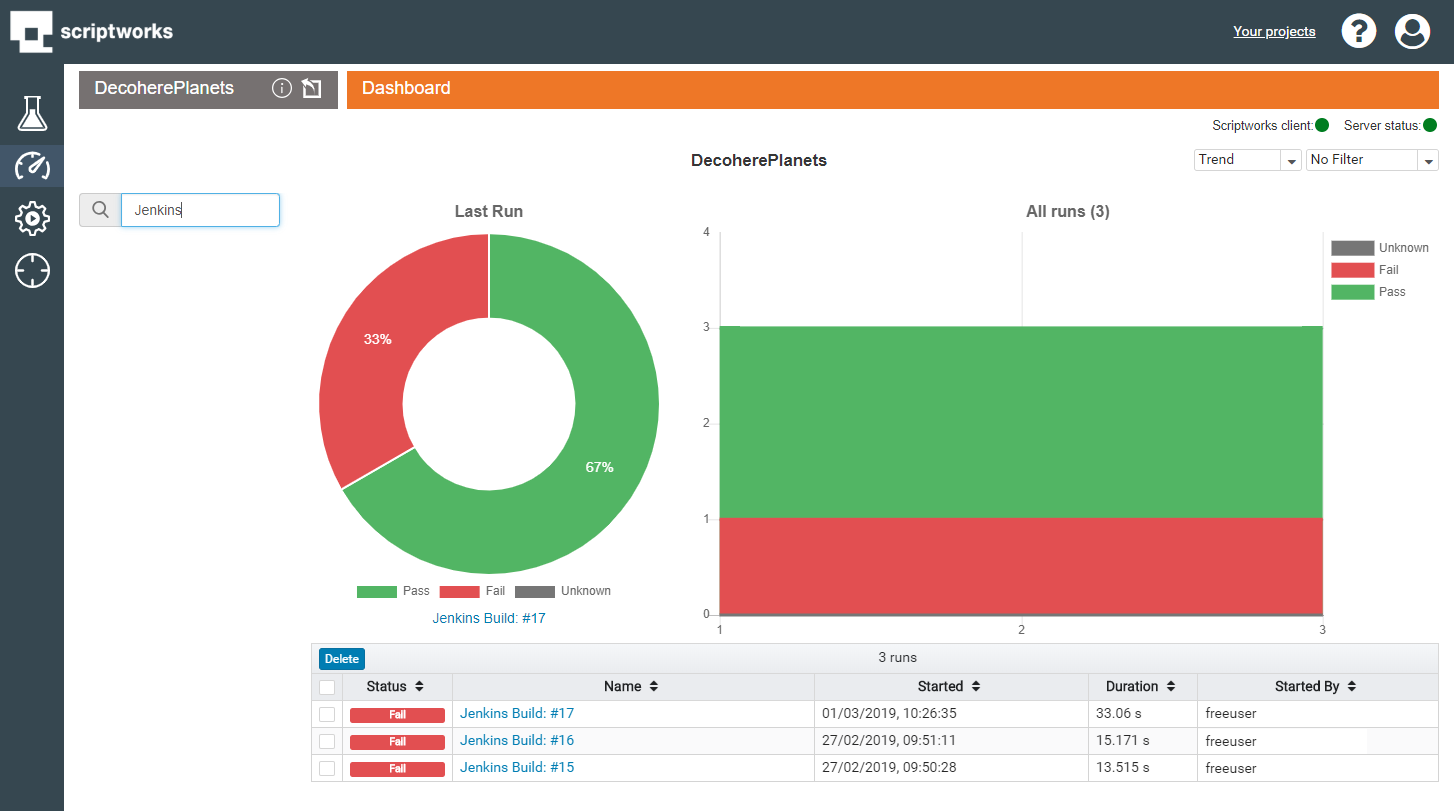
Test Runs can now be searched by name so anything run from your favoured CI environment can be picked up and analysed within a few keystrokes.
This has been a quick look through the new features in the Dashboard View in the recent Scriptworks UI upgrade.
Scriptworks – Run Anywhere, Run Concurrently.