This guide will show you how to use the Scriptworks Inspector to learn Web Application elements, the fields, buttons etc. that make up your application's user interface. This process adds them to the element list, so you can perform actions or validations on them as part of a test.
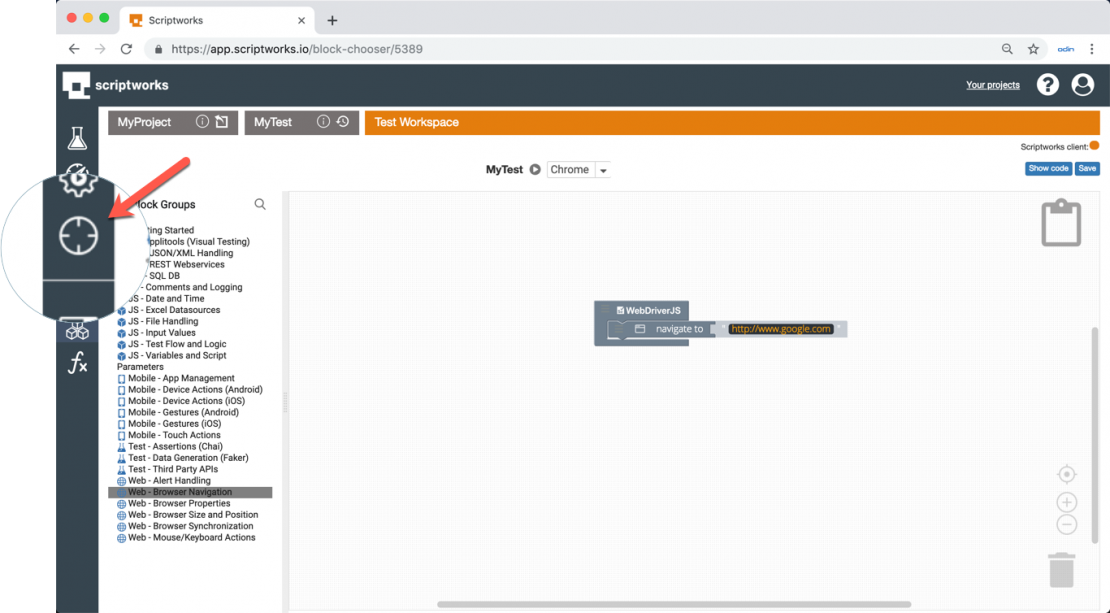
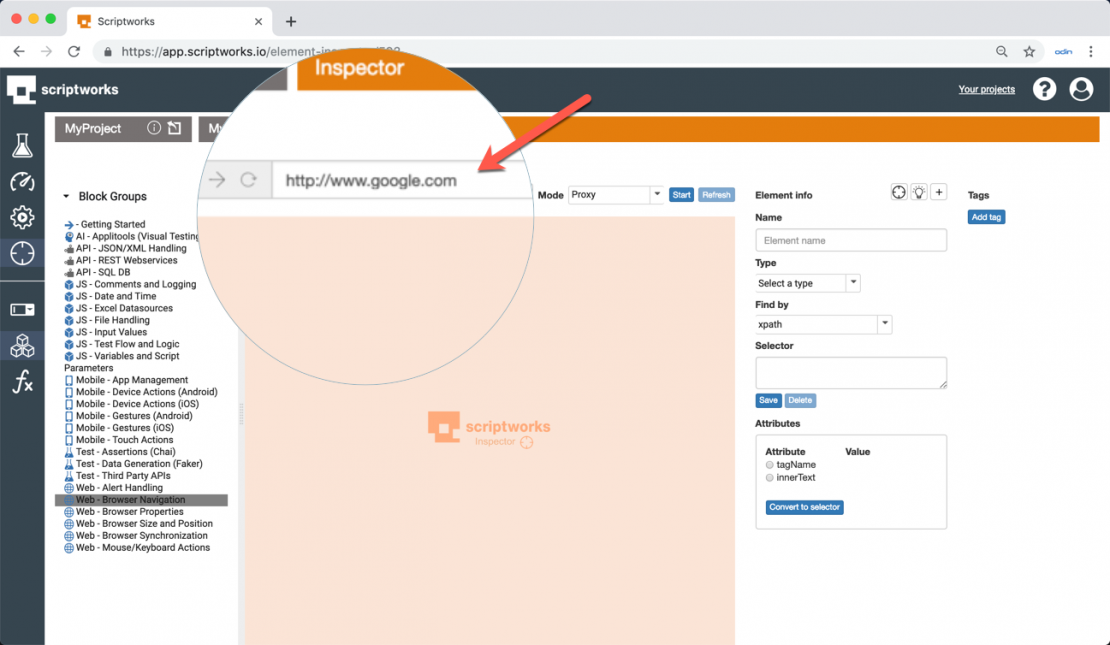
From within a project, click the Inspector icon:
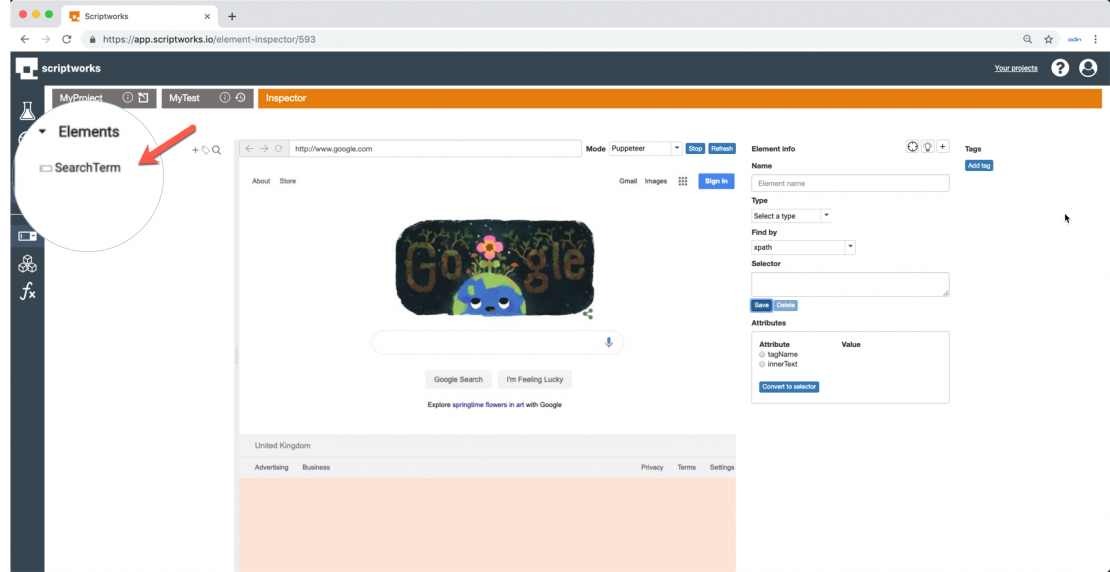
This opens the Inspector view, enter a URL into the URL field, including the http:// prefix:
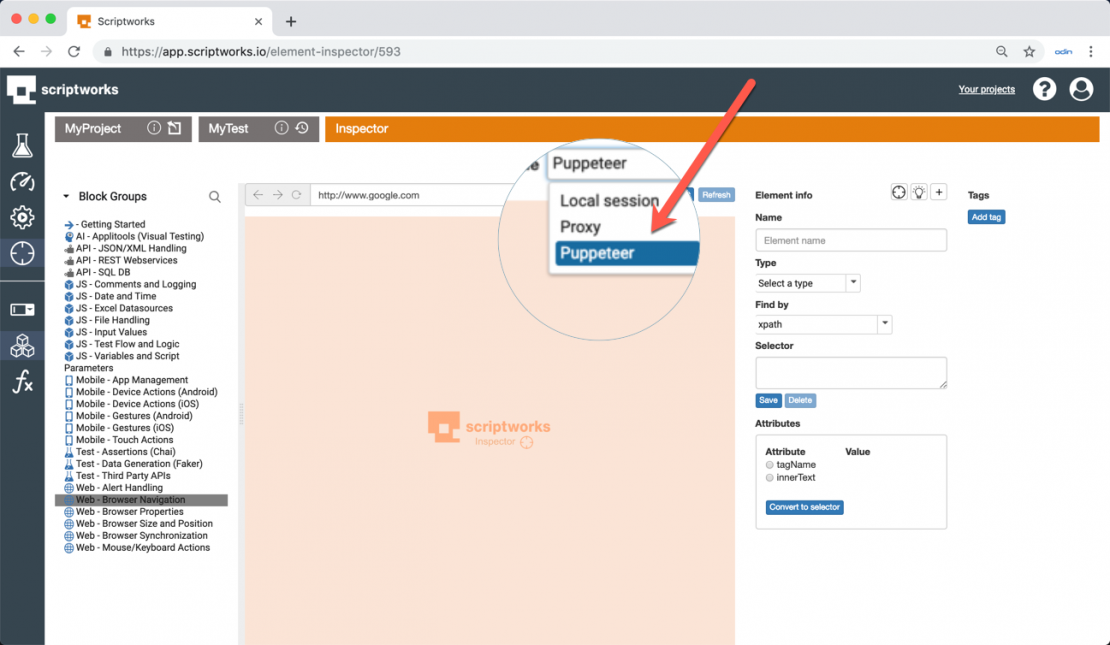
The Inspector has 3 modes of operation, Proxy, Local session and Puppeteer, these are explained below:
Quick and lightweight, this mode is useful for simple demonstration apps that are internet facing (publicly viewable). This mode uses a lightweight proxy mechanism to render the website in the Inspector frame so elements can be identified. The proxy will not render internal (non-internet facing) web apps, heavily scripted apps or those that use redirect mechanisms.
This mode renders the web app using a full Chromium browser engine launched by the Scriptworks client app, it presents the content of the browser in the Inspector Frame. Basic navigation and keyboard input is supported and relayed to the browser engine. The puppeteer mechanism will render both internal and external web apps and those that make use of complex scripted UIs.
This mode will launch a full browser or mobile app session using Selenium (What is Selenium?) or Appium, relaying the content to the Inspector Frame. Navigation and input can be performed in the Browser or Mobile device session and the Inspector frame can be refreshed with new content. Like puppeteer this mode will render both internal and external web apps as well as mobile applications. Note - This mode requires a fully configured Selenium or Appium server and configured Run Settings.
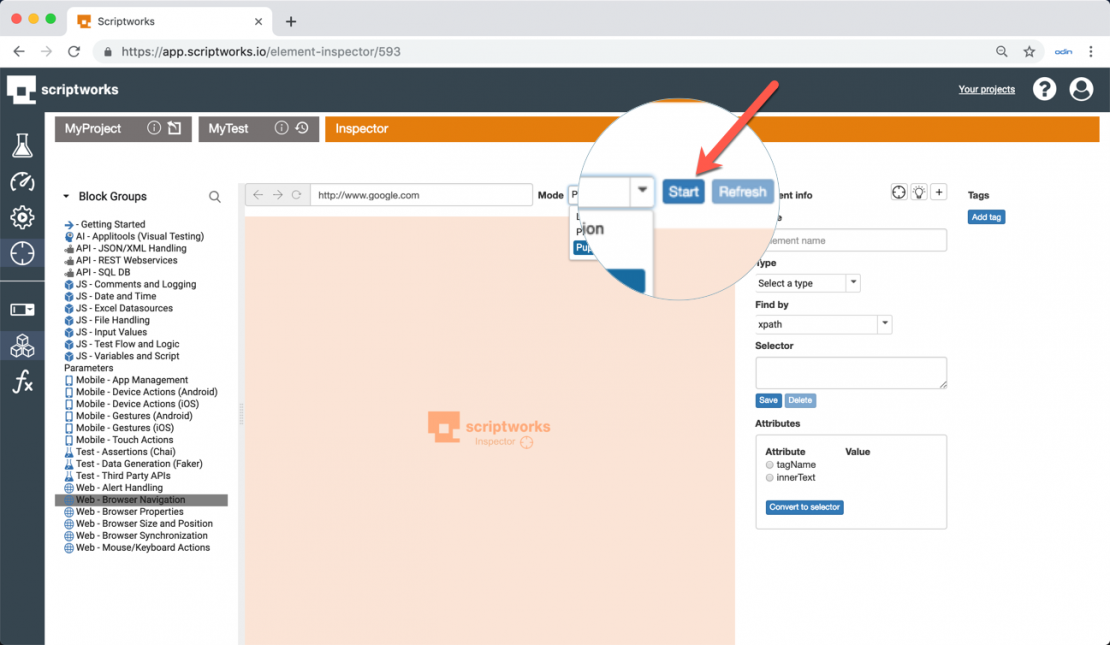
We will select Puppeteer for the purposes of the guide:
Hit the Start button:
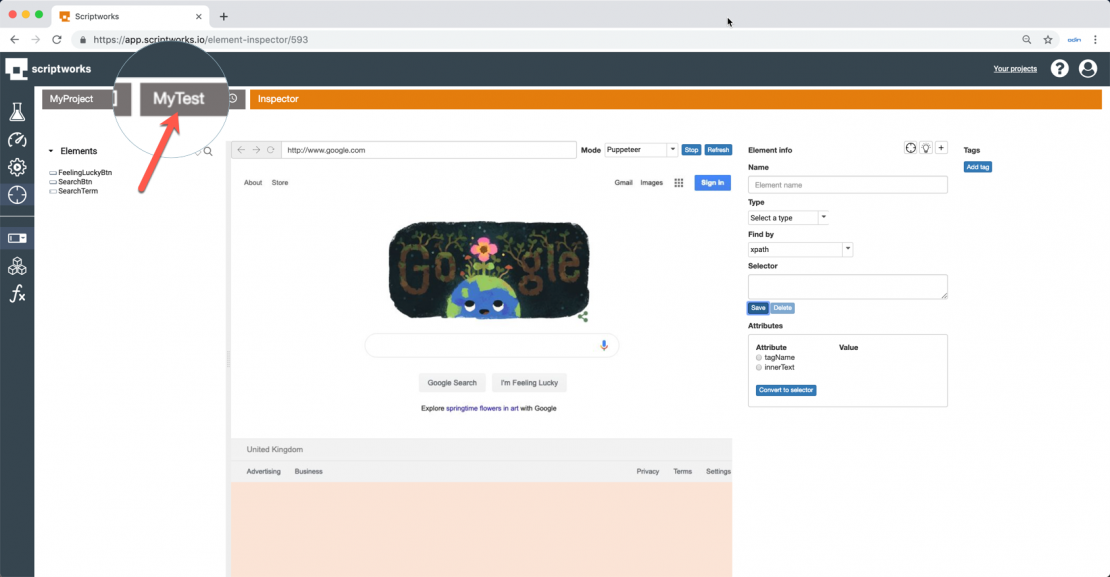
The website will be rendered in the Inspector Frame and Inspect Mode will be enabled (the crosshair icon will become highlighted):
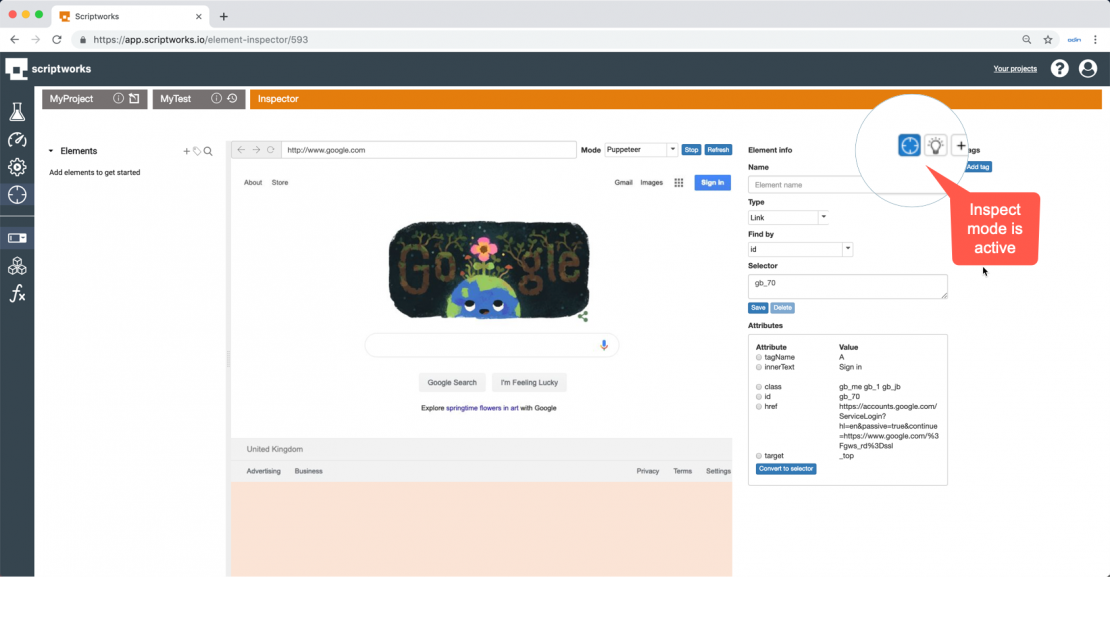
Moving the mouse over the Inspector Frame will highlight elements as they are hovered on, and attributes and selector information will be shown in the Element Info panel:
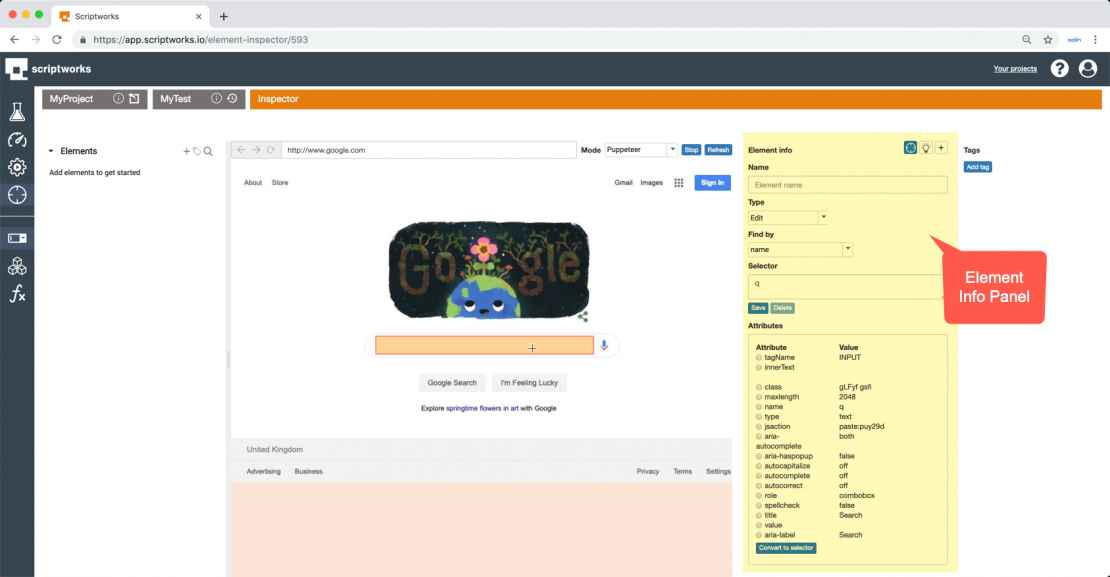
Simply click on an element to snapshot the properties in the Element Info panel. Inspect mode will cease and the newly learnt element can be given a name:

Notice the element has been given a Type and the Find by and Selector detail has been determined automatically for the element. This can be amended manually or selector details added manually based on other inspection tools, e.g. Developer tools.
To confirm that the Element can be identified by Selenium, use the Highlight Icon, this will attempt to locate and highlight the element in the Inspector frame:
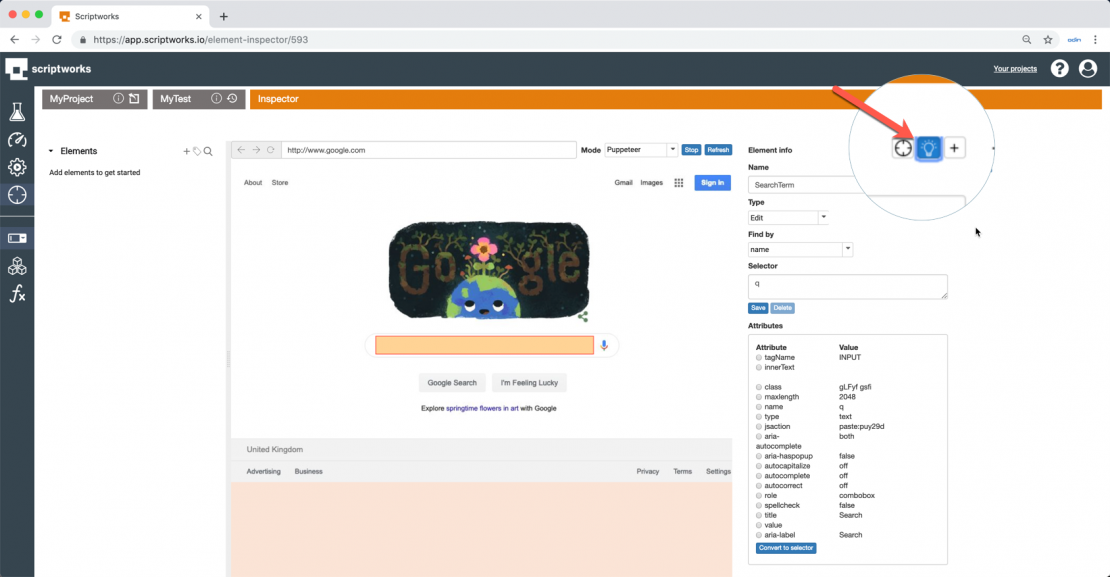
Tags can also be added to categorise elements and filter the element list for larger applications.
Click the Save button:

The Element will be added to the list and the Element Info section cleared:
Congratulations you've added your first element! Click the Crosshair Icon to re-Enable Inspect Mode and repeat the process.
When you are done learning elements, click the Stop button to end the Inspection session:

Next we will use the elements we have learnt in our test. Click the Test Name in the Breadcrumbs bar to return to the Test Workspace: